The clocks have gone back and the nights are closing in. Here in Sweden, it’s already dark by 3:30pm!
The dark, more than the cold, severely dampens my enthusiasm for cycling in the evenings after work — the lovely path along the edge of the lake becomes a harrowing edge over a black nothingness.
So, it’s time to bring the evening rides indoors. I’m not a fan of regular exercise bikes – you have to spend silly money to get a decent one, and then you get some weird geometry. I already have a great bike that’s been perfectly set up over a period of time to provide the correct geometry for my body. Why can’t I use that?
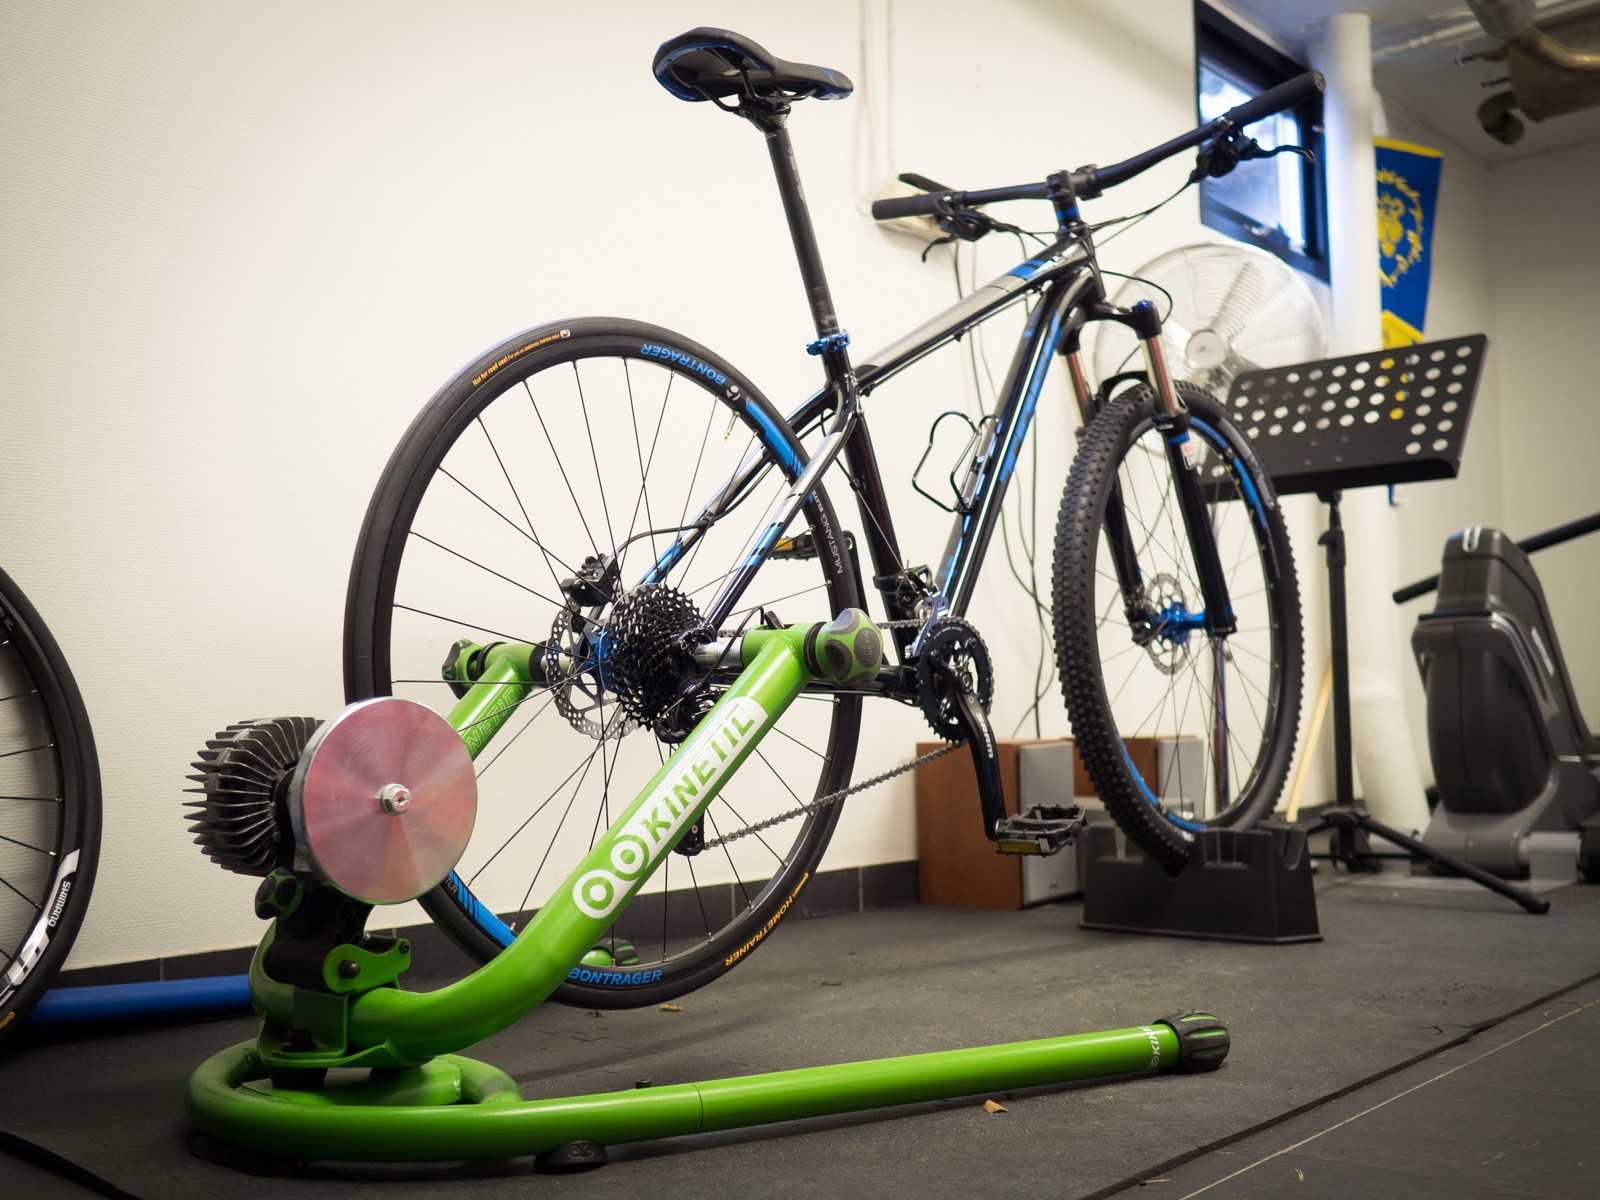
Thankfully, there are stationary trainers that let you do just that. I have a Kurt Kinetic Rock and Roll Smart stationary trainer — it has a built-in Bluetooth power meter so I can manage workouts on my phone, and is built to allow side-to-side motion of the bike. Not only does this simulate real riding better, it allows the lateral forces I put through the bike to be absorbed by the spring in the trainer and not my rear wheel’s axle and rear triangle, putting to rest fears of stressing parts of the bike that don’t normally take those sort of forces.
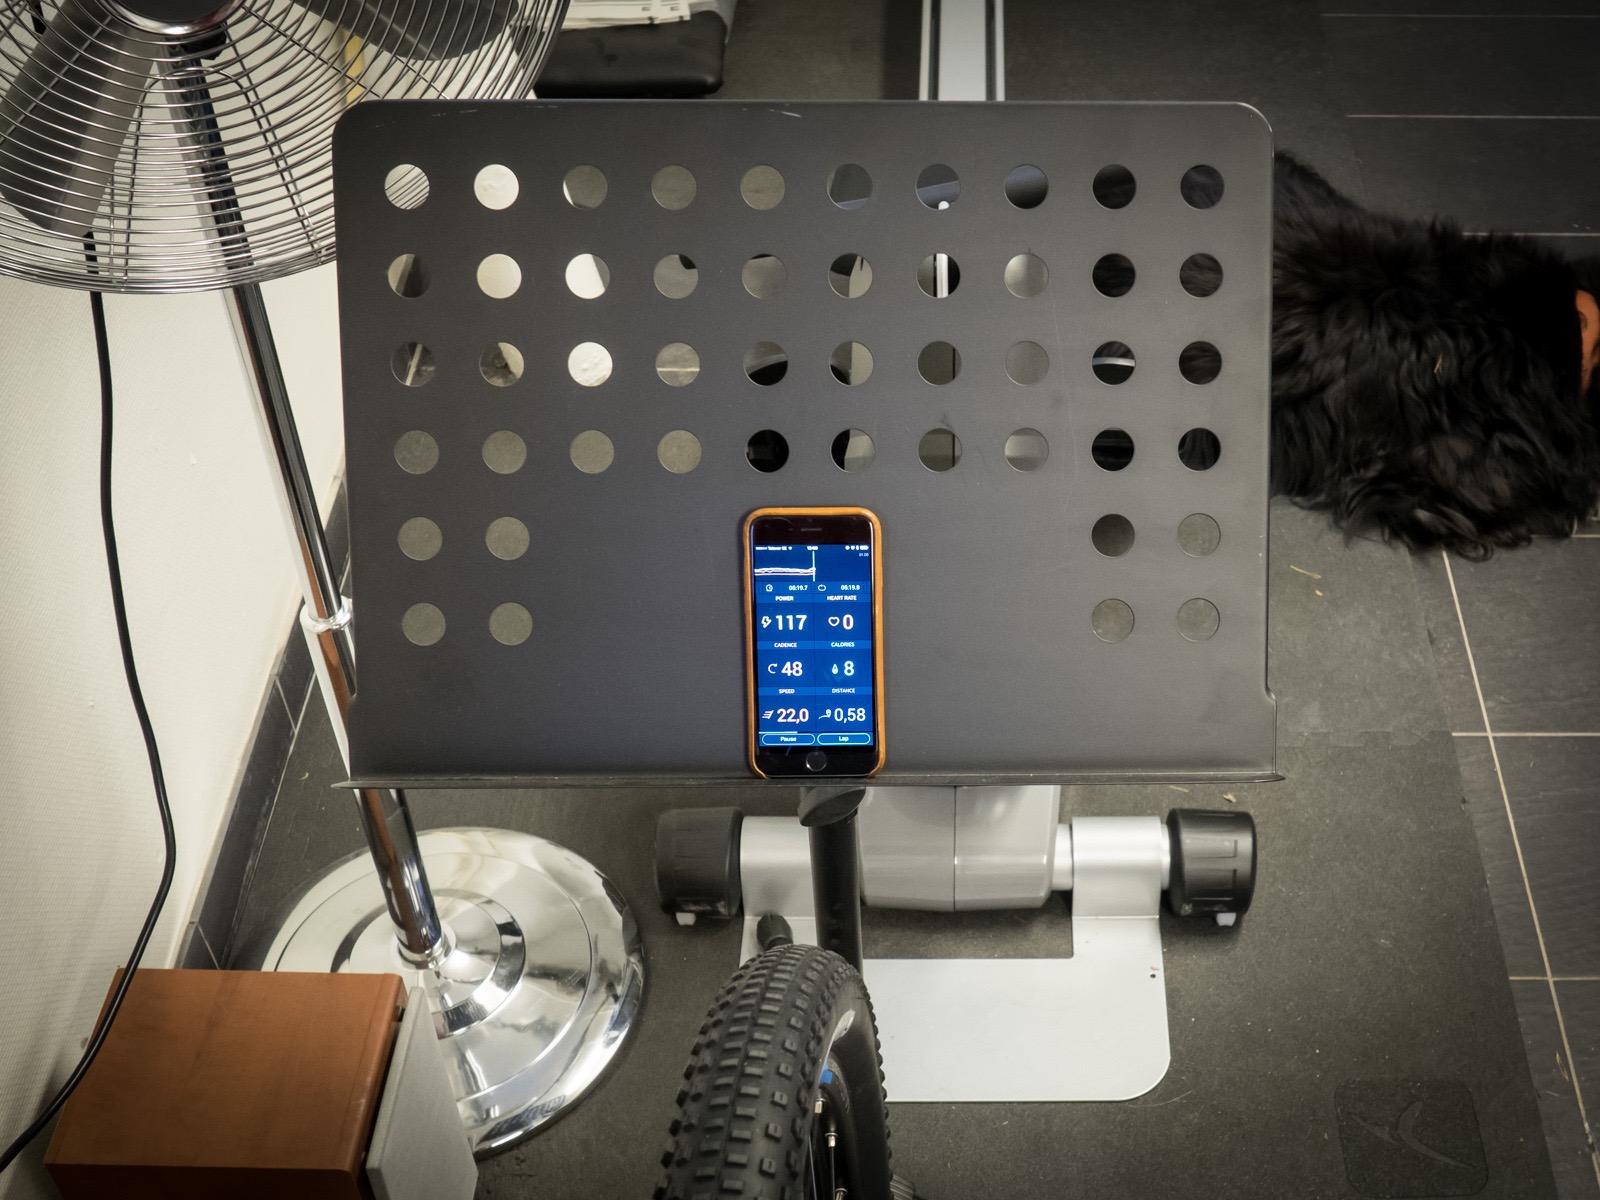
Anyway! I’m all set up — this is gonna be just like riding outside!
…Oh.
Well, that’s boring. Why don’t I record a video of my ride to play back while I’m training? And if I’m doing that… it’d be great if I can overlay some data so I can match my pacing to the ride on the video. I use a Garmin VIRB XE camera, the software for which can import the data from my Garmin GPS to overlay my heart rate, speed, pedalling cadence and more over the video. This sounds perfect!
Unfortunately, this is where we hit a snag. The trainer I have has a “fluid” resistance unit, which ramps up resistance with speed — when I pedal fast in a high gear it’s difficult, and when I pedal slowly it’s easy. This sounds sensible enough until you realise that the hardest parts of my ride are up steep hills on off-road trails — I’m putting a ton of power down, but I’m travelling really quite slowly. This means that overlaying speed data onto my video is useless since the trainer is basically simulating a perfectly level road. What I need to overlay on my video is a readout of the actual power I’m putting out at any given moment.
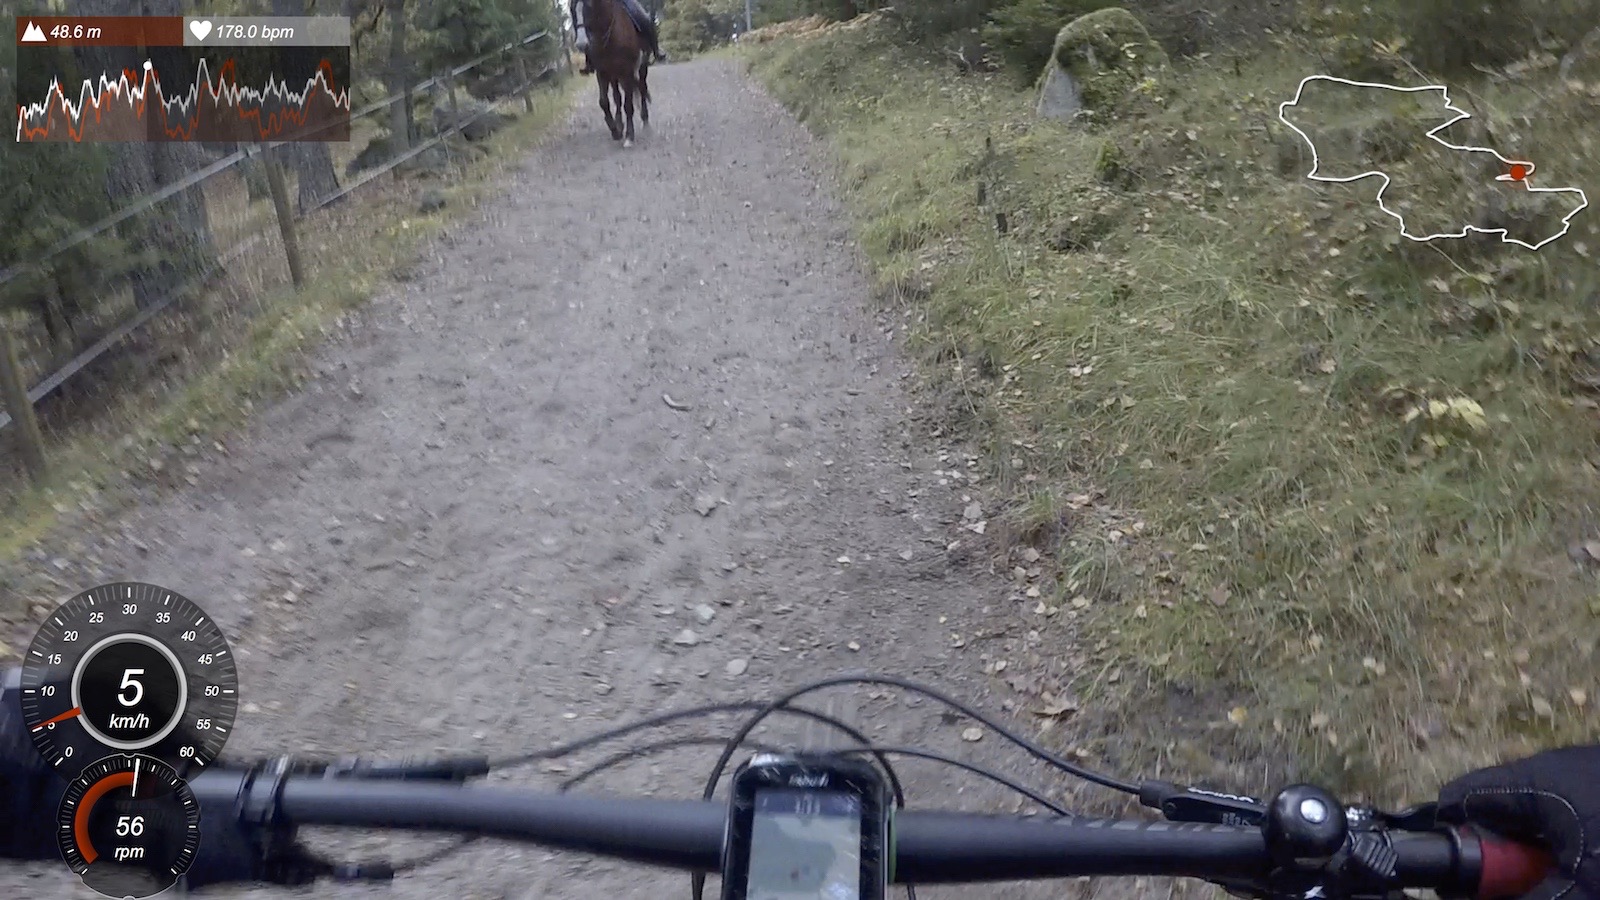
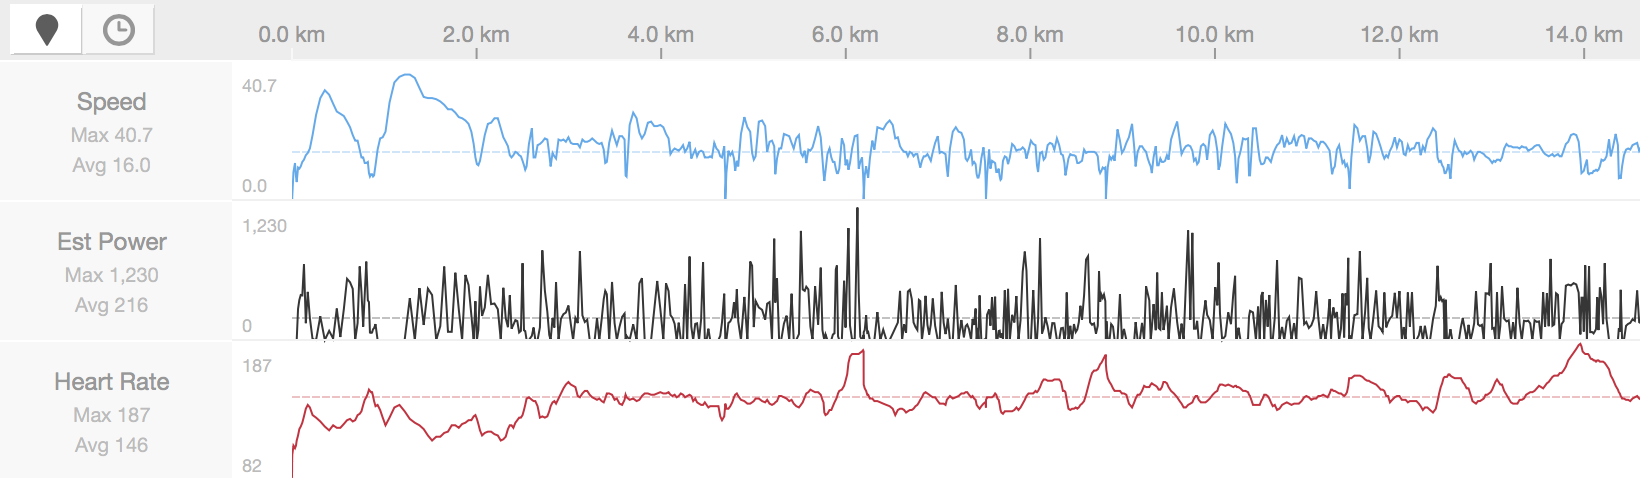
I’m doing 5km/h here, but outputting nearly 300W. 5km/h on my trainer gives an almost negligible power output.
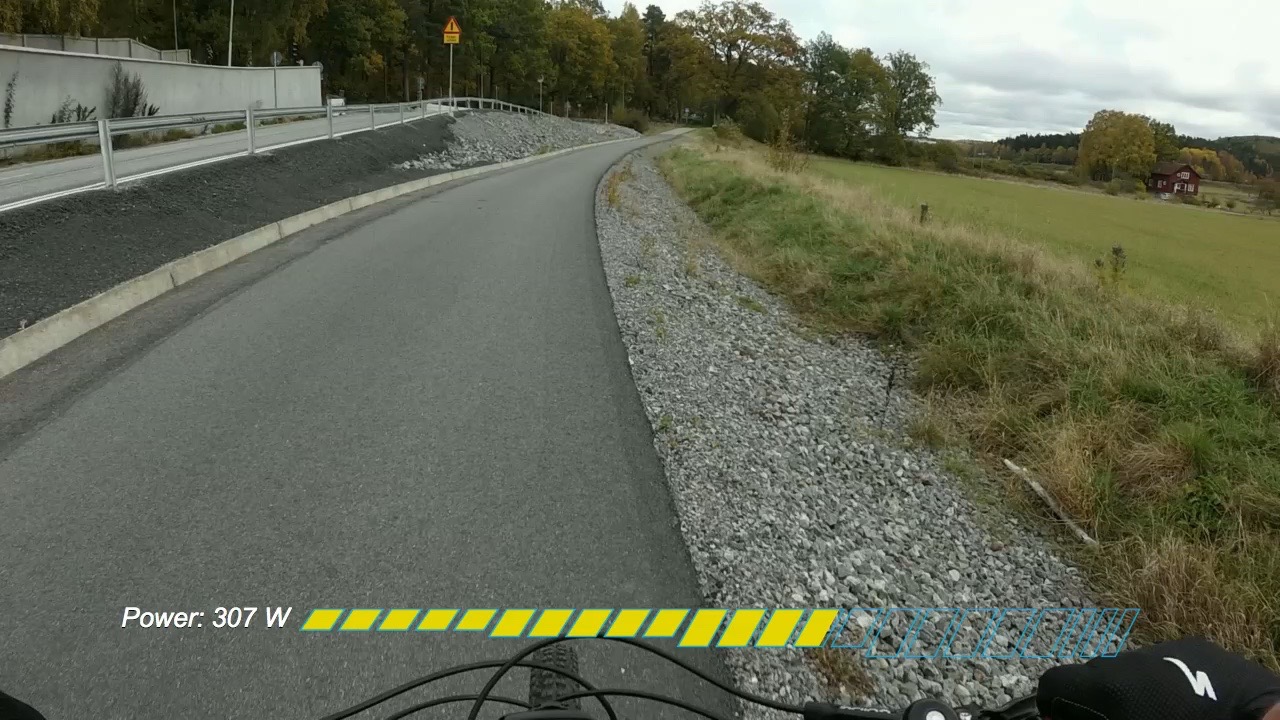
After a weekend of mucking around with several horrible looking programs, I finally managed to get a simulated-but-accurate-enough power figure into Garmin’s software, allowing me to overlay power output onto my video:
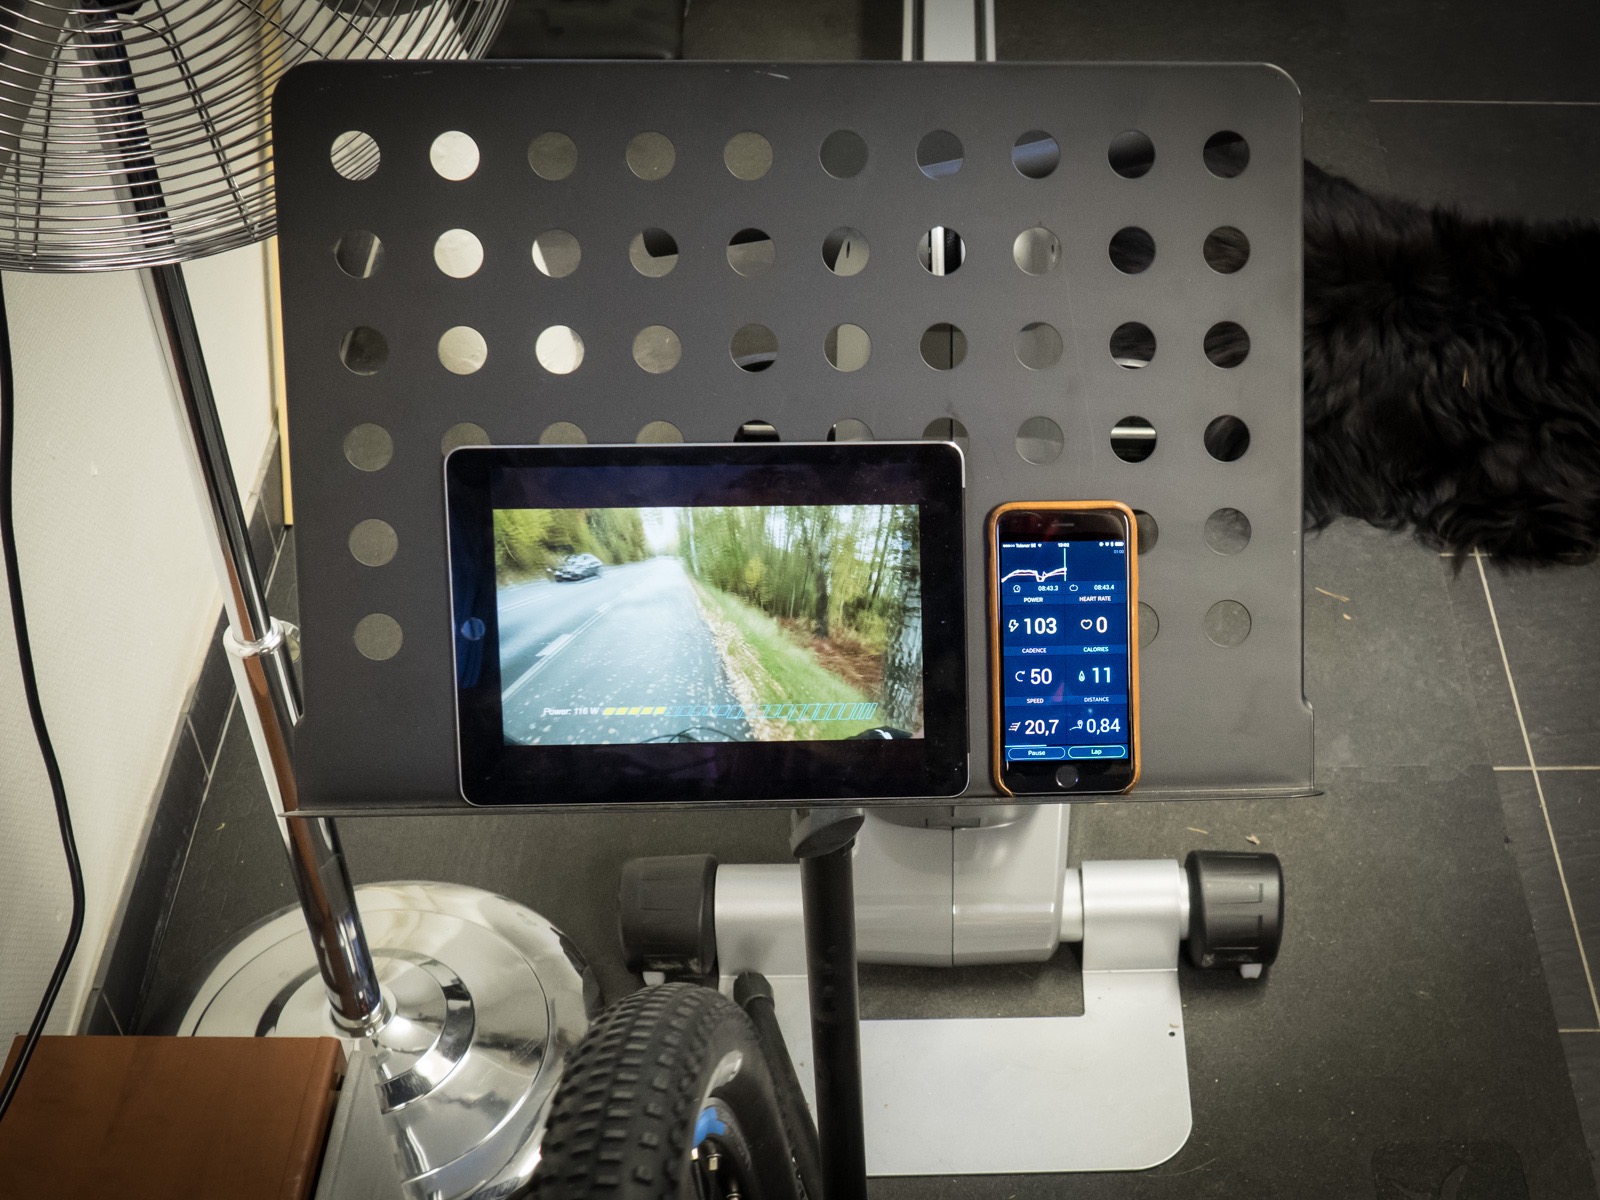
Now when riding indoors I can put my iPad and iPhone on a music stand (make sure you get a sturdy one!) and reproduce my outdoor ride by matching my live power output on the trainer to the one displayed in the video.
I love this method of training. It gives me something to look at while riding, and because it’s realtime from my ride, I get great pacing — it’s on local trails I know and ride frequently, and when I need rest stops, I’m already stopping to rest on the video.
Producing Simulated Power Data
So, how to we get that live power overlay?
The easiest option would be to buy an actual power meter for my bike. Most of them are designed for road bikes, and all of them are expensive — you’re looking at towards $1,000, which is a bit spendy for a project like this.
So, with that out, we need to simulate our power data. I use the popular site Strava to track my rides, and they provide a pretty decent-looking “simulated” power graph for each ride:
Annoyingly, though, there’s absolutely no way to get this data out of Strava in any meaningful way, so that’s out. Garmin’s similar service, Garmin Connect, doesn’t produce this data at all, so that’s out too.
Looks like we’re going to have to do this manually!
Ingredients
- A video recording of a bike ride.
- Some recorded telemetry data from that same ride, such as from a GPS unit.
- GoldenCheetah, an open-source data management application.
- Fitness Converter, a free application by yours truly for converting fitness files between formats.
- Garmin VIRB Edit, a free video editor that can overlay data onto your video.
Method
First, we’re going to load our recorded telemetry data (heart rate, speed, pedalling cadence, etc) from the GPS into GoldenCheetah, a piece of software for working this this sort of thing. Once imported, clicking the “Ride” tab should show graphs of your data:
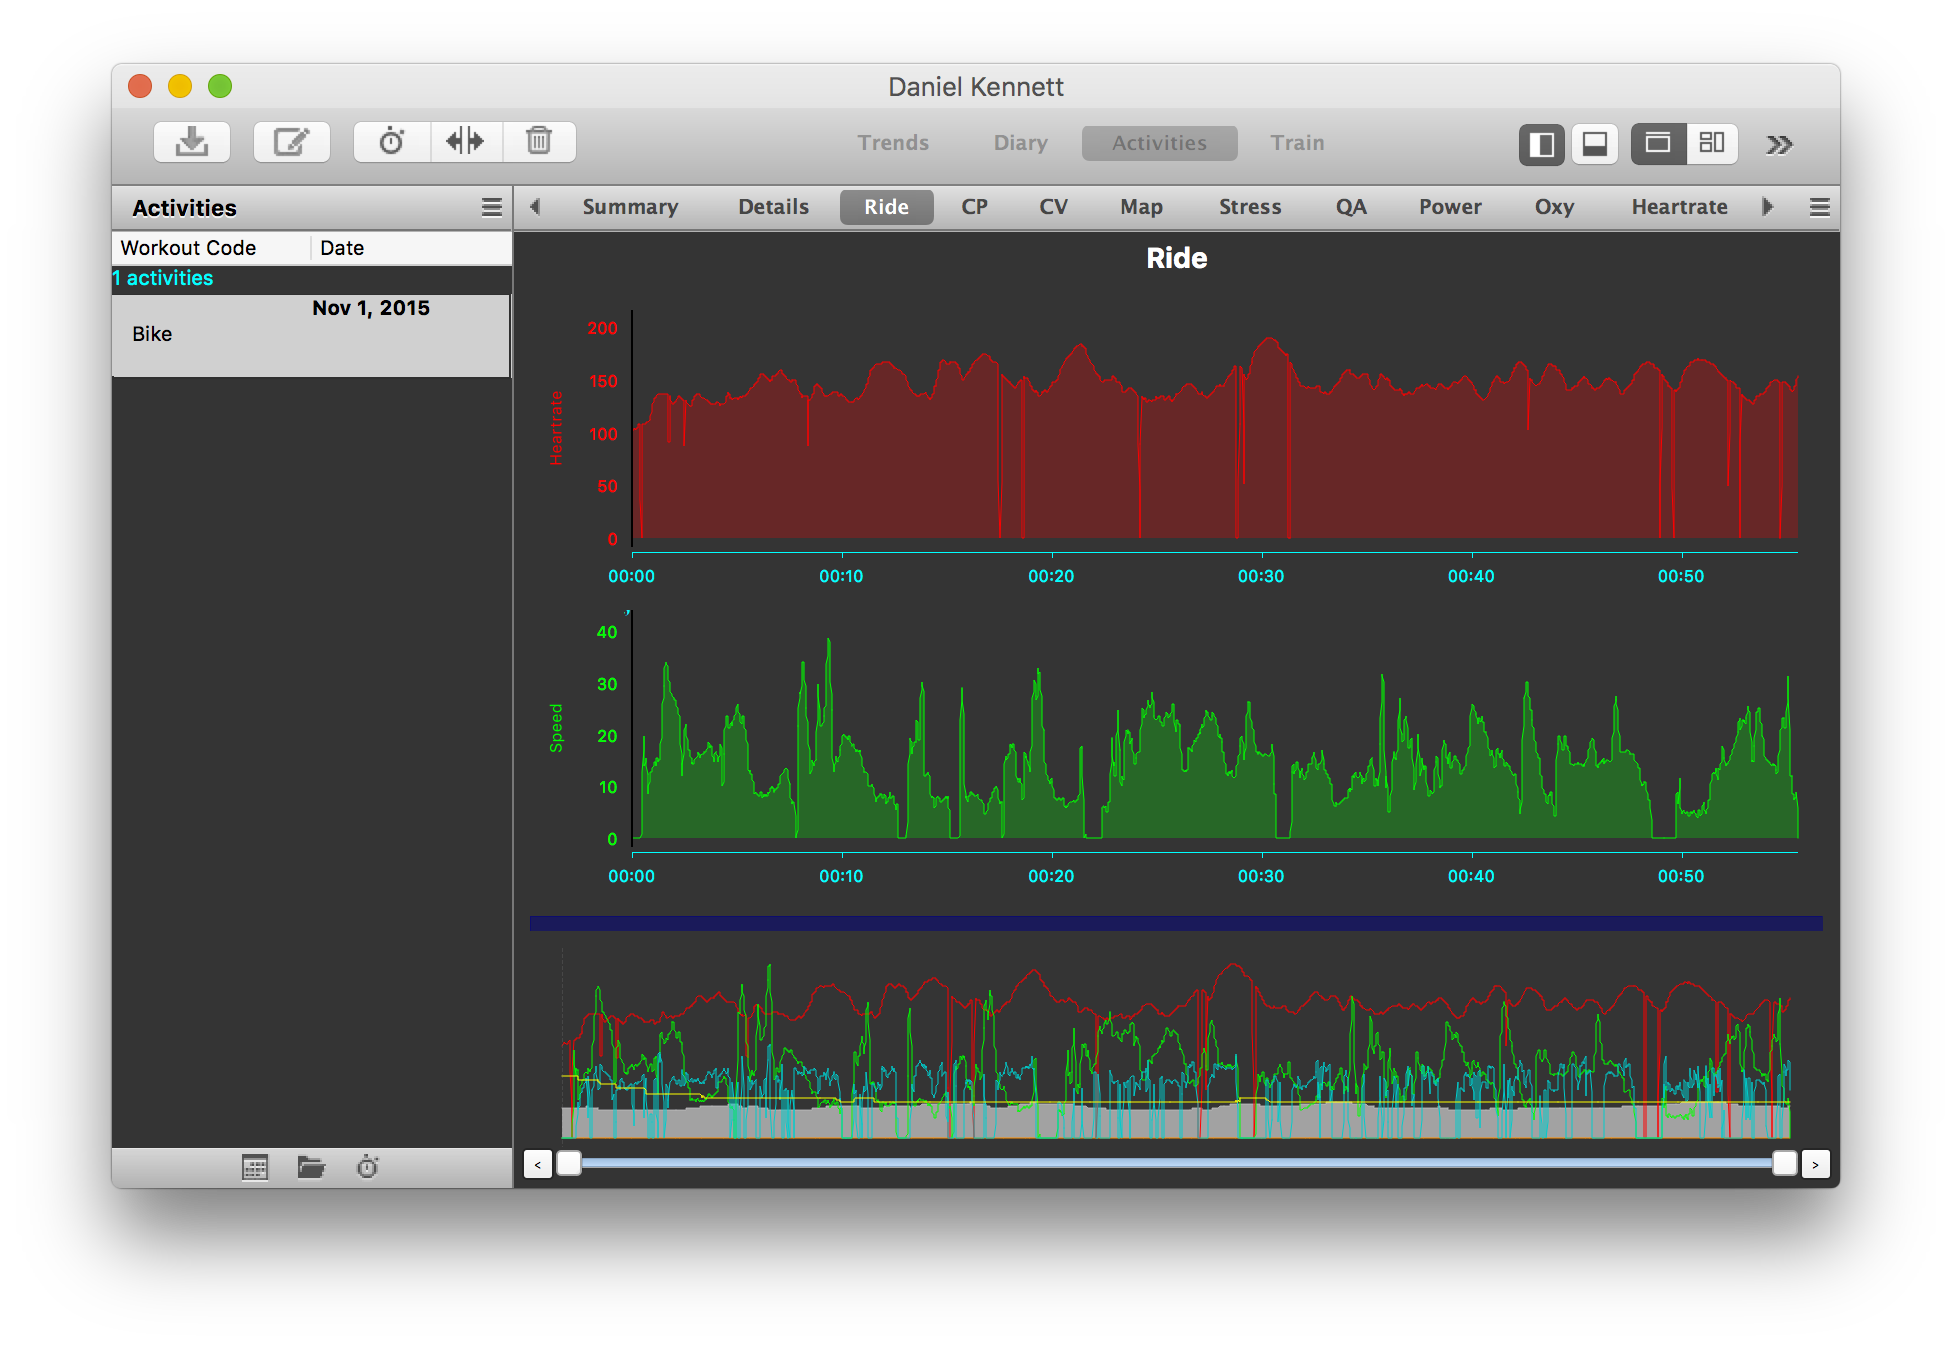
Note: On the first launch, GoldenCheetah will ask you to set up a profile. You need to enter an accurate weight for you and your bike to get accurate power data.
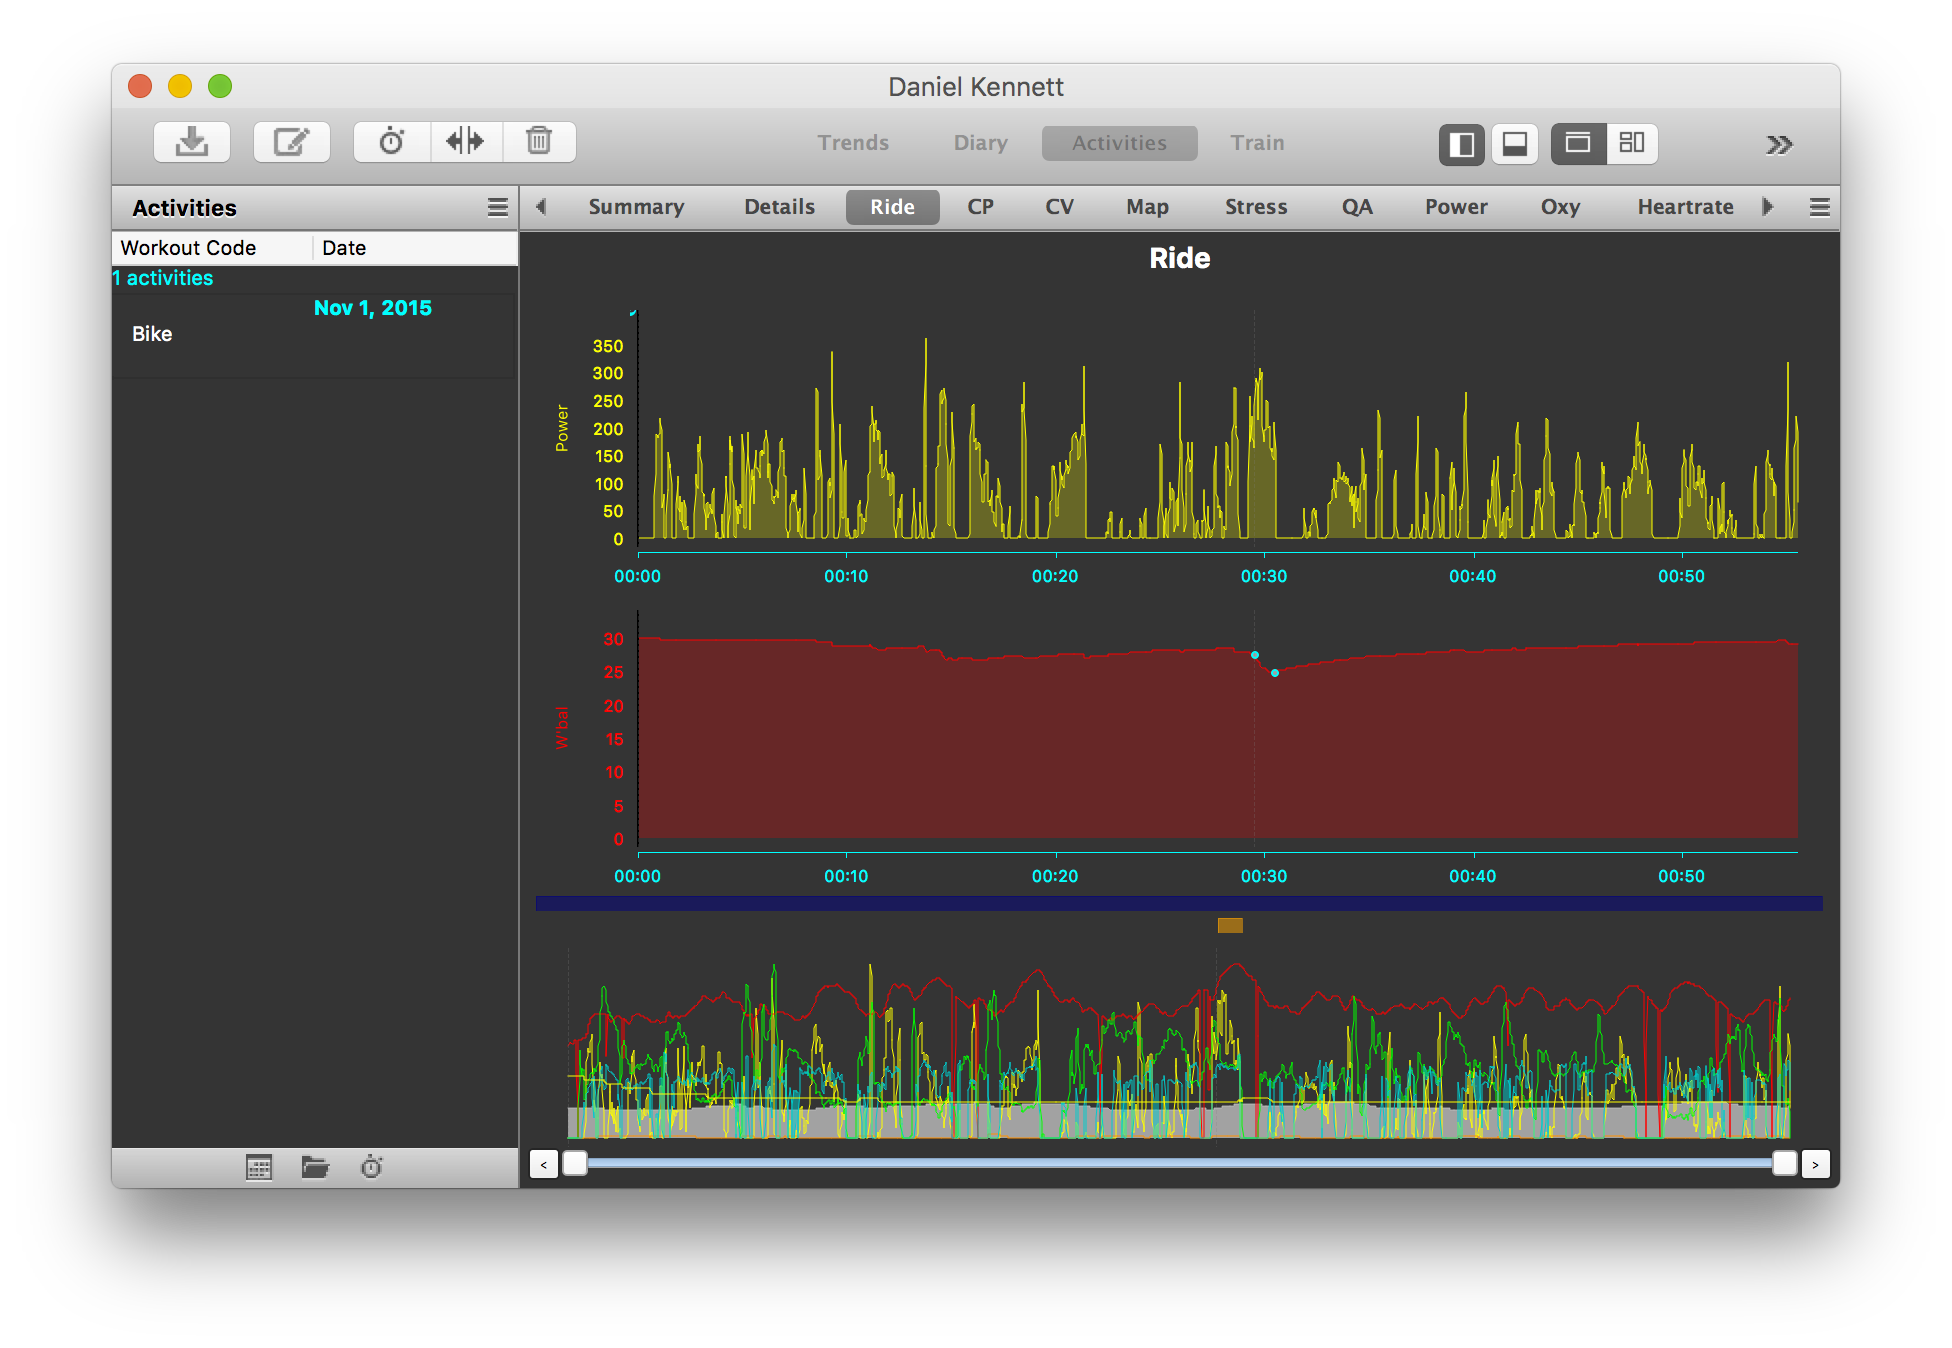
Next, choose “Estimate Power Values…” from the Edit menu. Once you complete the process, you’ll see more graphs added to your data, including a “Power” graph. If you have other data to compare to, such as Strava’s Simulated Power graph, you can compare them, and if GoldenCheetah’s data is significantly wrong you can choose “Adjust Power Values…” from the Edit to move it all up or down.
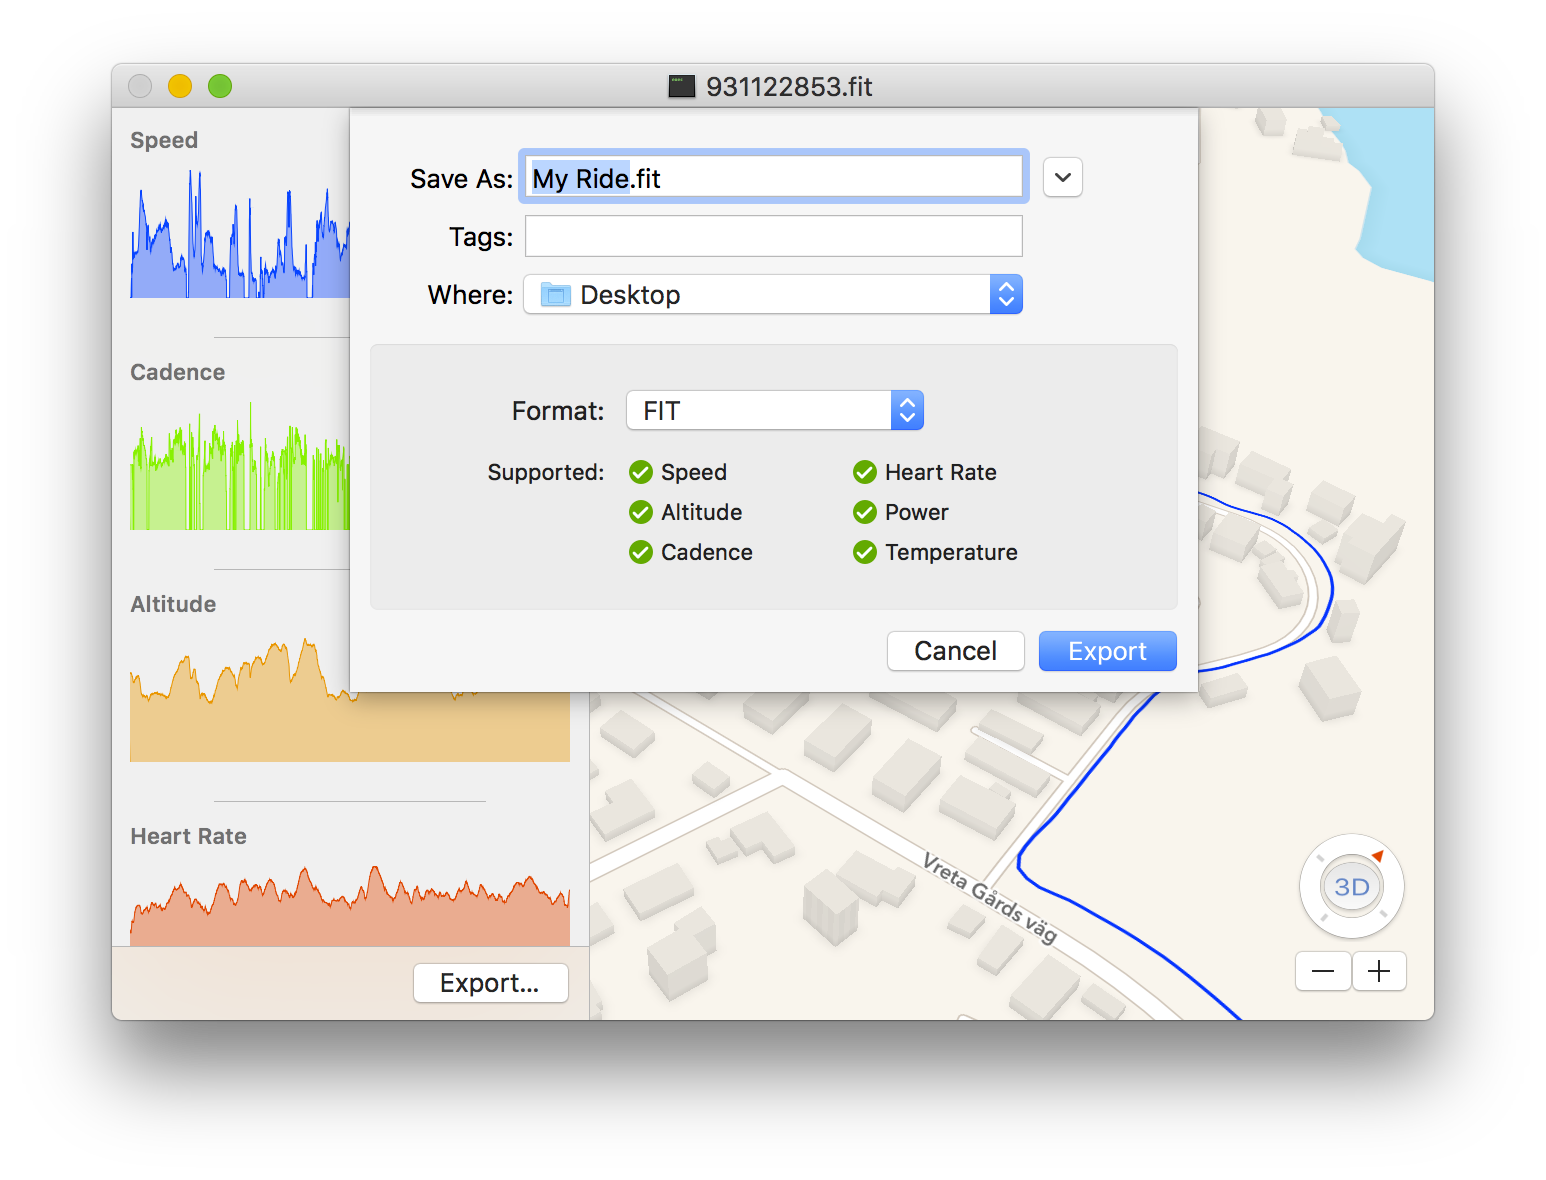
Finally, choose “Export…” from the Activity menu to export the file as a TCX file.
Unfortunately, we’re not quite there — Garmin’s software can’t import TCX files, so we need to convert our new file to the FIT format. The best pre-existing solution I could find for this was really quite terrible, so I ended up writing my own (as you do): Fitness Converter.
Once the data is in the FIT format, we can import it into VIRB Edit. Since the VIRB XE camera has GPS in it, it has the accuracy to automatically sync the data from my GPS unit (now with added power data!) perfectly. If you’re not in this position, you can manually sync your data file to the video.
…aaand, we’re done. You can now add your graphs and overlays as you wish using VIRB Edit. Since speed is completely irrelevant in this instance, I leave all that out and just have a single giant power bar — it’s easy to read when working out over a constantly changing number.
Happy training!
Next training spend: a bigger screen!